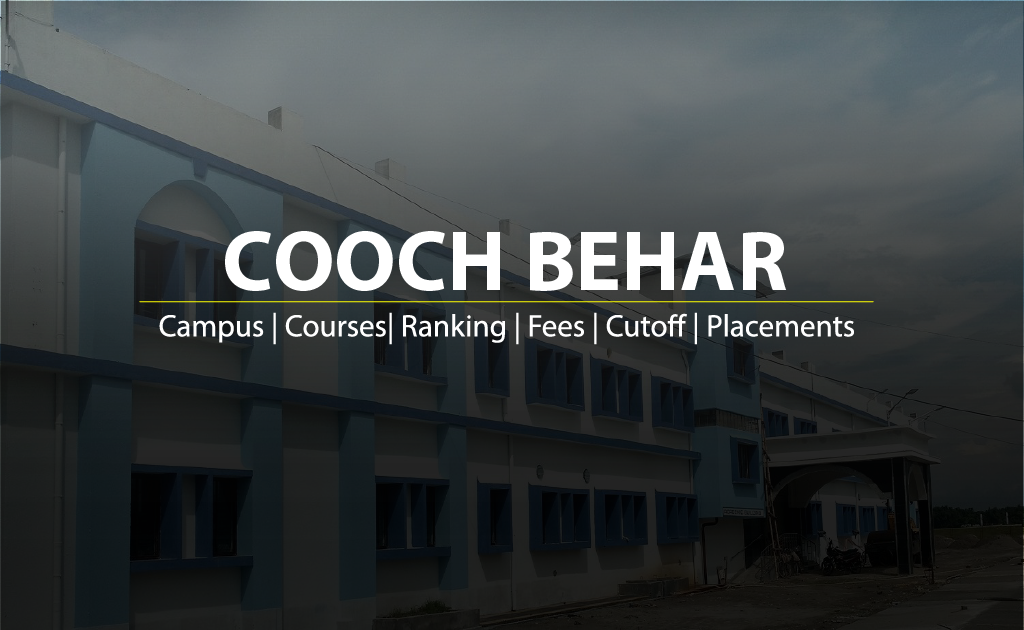
Cooch Behar Government Engineering College is a new entrant in the fraternity of Government Engineering Colleges. The college is having five streams: ECE, EE, CSE, CE, and ME. Quality and infrastructure of Laboratories of this college are excellent. Each department possesses smart classrooms.
ESTABLISHED - 2016
BASIC DETAILS
| Cooch Behar Government Engineering College | |
|---|---|
| Full address: | Village: Harinchawra, Post Office: Ghughumari, District: Cooch Behar, West Bengal – 736170 |
| Landmark: | Near the Torsha Bridge at Harinchawra on Cooch Behar – Dinhata Road |
| GPS: | “26.293384 N, 89.460160 E” |
| Website | http://www.cgec.org.in/ |
| Admission in charge | Dr. Palash Das |
| 9937013180 | |
| d.palash@gmail.com | |
| Link to A/V (if any) | https://youtu.be/uIx7X9gInFM |
CAMPUS
INFRASTRUCTURE DETAILS
| No. of classrooms: | 20 | No. of e-classrooms: | 05 |
|---|---|---|---|
| No. of books in library: | 8032 | No. of titles in library: | 409 |
| No. of laboratories: | 48 | Workshop: | Yes |
| Common computing centre: | Yes | No. of common computers: | 300 |
| Indoor sports facility | Yes | Outdoor sports facility | Yes |
| No. of seats in boys’ hostel | 1st year: NIL, 2nd year: NIL, 3rd year: 200, 4th year: 200 | No. of seats in girls’ hostel | 200 |
| Boys’ common room | 01 | Girls’ common room | 01 |
COURSES
| Name of branches | Approved Intake | NBA Accredited | No. of full time Faculty Members |
|---|---|---|---|
| 1. Electrical Engineering (EE) | 54 | Yes | 05 |
| 2. Electronics and Communication Engineering (ECE) | 54 | No | 06 |
| 3. Computer Science and Engineering (CSE) | 54 | No | 06 |
| 4. Civil Engineering (CE) | 54 | No | 04 |
| 5. Mechanical Engineering (ME) | 54 | No | 04 |
FEES
| Departments | 1st Sem | 2nd Sem | 3rd Sem | 4th sem | 5th Sem | 6th Sem | 7th Sem | 8th Sem |
|---|---|---|---|---|---|---|---|---|
| CSE, ECE | 12,400 | 6,000 | 6,000 | 6,000 | 6,000 | 6,000 | 6,000 | 6,000 |
| EE, CE, ME | 8,900 | 3,000 | 3,000 | 3,000 | 3,000 | 3,000 | 3,000 | 3,000 |
CUTOFF
PLACEMENT
| Year | Percentage of students placed through campus interview | Maximum CTC | Average CTC |
|---|---|---|---|
| 2019 | 17% | 5LPA | 3.64LPA |
| 2018 | % | LPA | LPA |
| 2017 | % | LPA | LPA |
GALLERY


